Free spreadsheet
Monthly Sales Forecast & Actuals
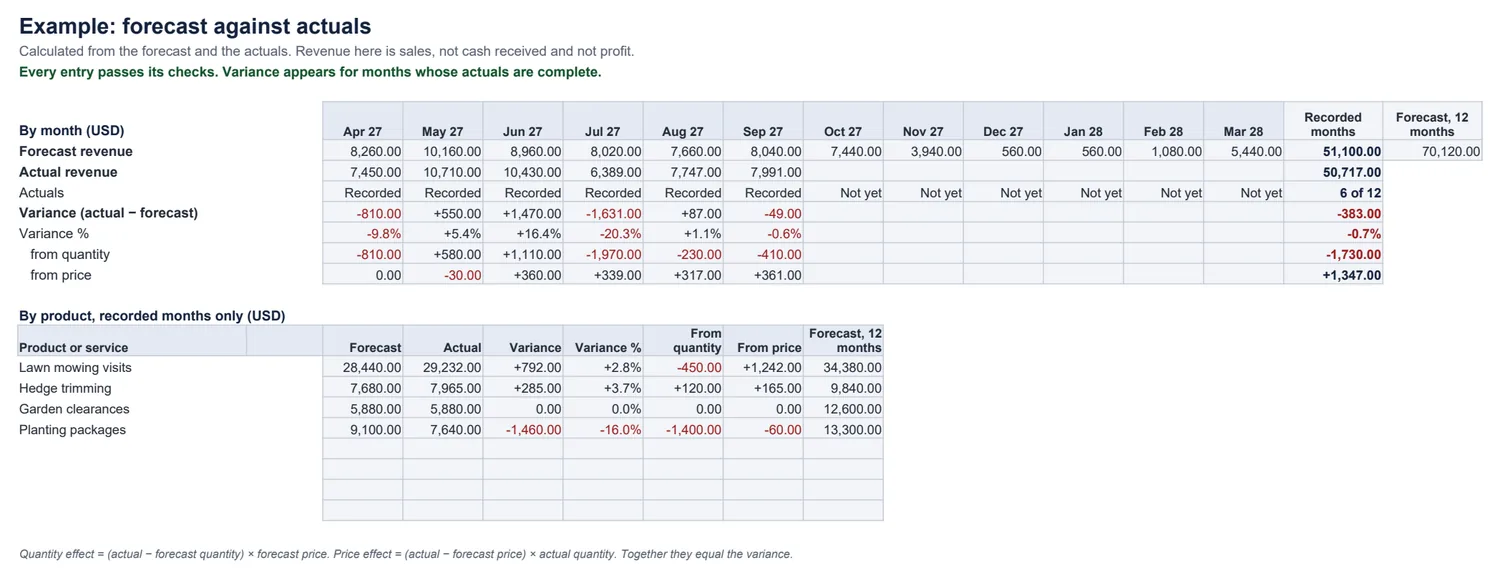
Plan the next twelve months of sales by product or service, then record what really happened each month. The workbook shows where you were ahead or behind, and whether the difference came from selling more or fewer, or from charging more or less.
Are my sales ahead of the plan, and why?
How the numbers are worked out
Revenue = quantity × average priceVariance = actual − forecast; % = variance ÷ forecast (n/a if 0)Quantity effect = (actual qty − forecast qty) × forecast pricePrice effect = (actual price − forecast price) × actual qty- A month counts as recorded only when every product has an actual quantity; partly recorded months show no variance.
- Missing prices, negative numbers and unnamed products are counted at the top of the analysis.
Worked example
A garden-services business forecast $8,960 for June and sold $10,430: +$1,470. Selling more visits and jobs was worth +$1,110; the mowing price rise from $45 to $48 was worth +$360. In a dry July it sold $1,631 less than forecast, almost all from fewer visits.
Common questions
How are the quantity and price effects worked out?
Quantity effect = (actual quantity − forecast quantity) × forecast price: what selling more or fewer was worth at the price you planned. Price effect = (actual price − forecast price) × actual quantity: what charging more or less was worth on what you actually sold. Together they always equal the variance.
What if I forecast zero for a month?
The percentage shows “n/a” instead of an error. If you did not set a forecast price either, the actual price is used, so any sales count as a quantity effect.
Does it predict my sales?
No. The forecast is the quantities and prices you enter, with the assumptions you write down. The workbook adds no growth rates; it compares your plan with what happened.
Is forecast revenue the same as cash or profit?
No. Revenue is what you sell. Cash arrives when customers pay, which may be later, and profit depends on your costs. Use the 13-week cash-flow forecast or the job profitability spreadsheet for those.
Which spreadsheet apps does it work in?
It is a standard .xlsx file with ordinary formulas and no macros. We checked the example and edits such as part-recorded months, zero forecasts and missing prices in LibreOffice Calc. It has not been tested in Excel, Google Sheets or Numbers.